See your numbers on one screen.
Dashboards
In simple words: We turn your data into a live dashboard, so your team sees prices, leads or trends on one screen instead of in scattered files.
Dashboards your team actually opens: prices, leads, rankings and trends, connected to live data and updated automatically.
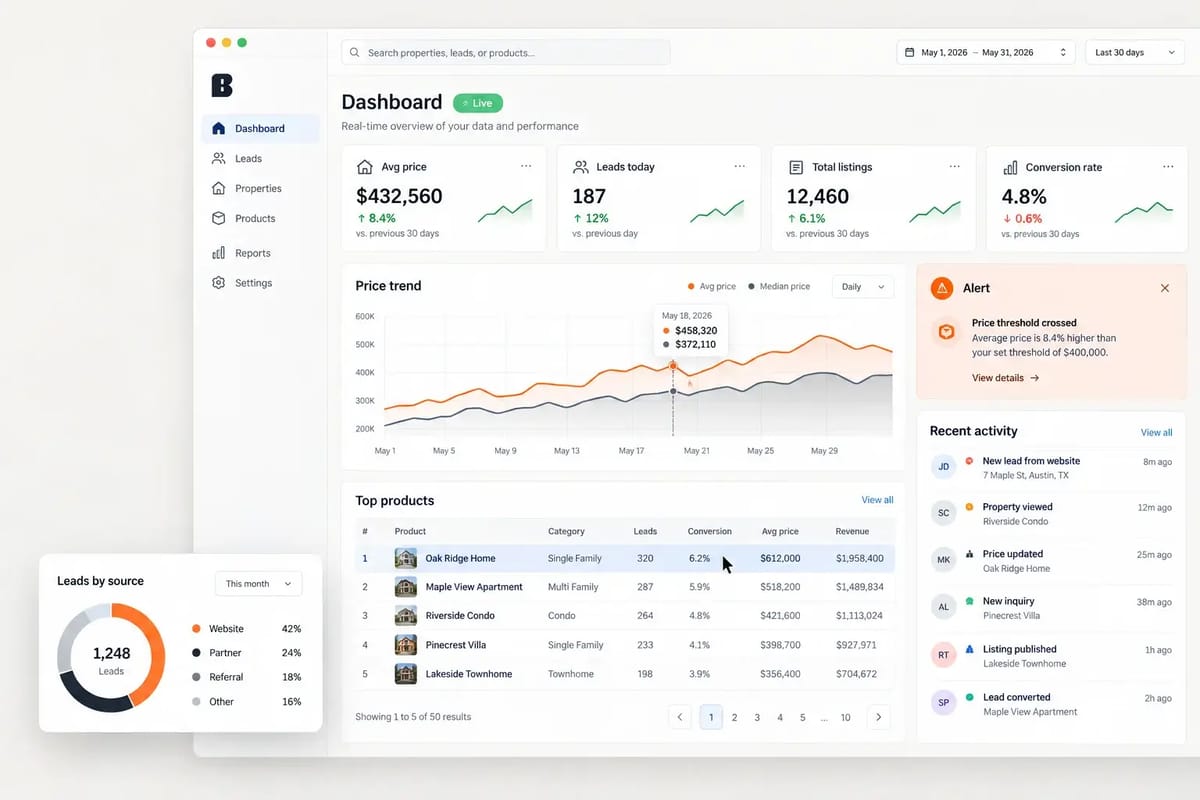
For example: A pricing team shared screenshots of spreadsheets to discuss competitor prices. The team discusses prices from one live view every morning. See how we did it ↓
The problem
Why teams come to us
Your data lives in exports and spreadsheets, so nobody sees the full picture until someone builds a report by hand.
What you get
- Dashboard design around your key questions
- Live connections to your data sources
- Charts, tables, filters and alerts
- Scheduled refresh
- User access control
- Embedding in your app or website
Benefits
What changes for your team
Everyone sees the same numbers
Faster decisions
No manual reporting
Alerts when something changes
How it works
From first call to working result
- 1
Discovery call
A free 30-minute call to map your goal, sources, volume and where the result should land. NDA on request.
- 2
Sample first
We build a small working sample so you can check fields, format and quality before the full build.
- 3
Build & test
We build the full solution, test it on real data and edge cases, and share progress as we go.
- 4
Deliver & support
You get the result, the source code and short handover notes, plus fixes during the support window.
Example project
A price dashboard for the whole team
- The challenge
- A pricing team shared screenshots of spreadsheets to discuss competitor prices.
- What we built
- We built a live dashboard on top of their scraped price data with filters, trends and alerts.
- The outcome
- The team discusses prices from one live view every morning.
An illustrative example of a typical dashboards engagement.

Use cases
Where this helps
Tech stack
Tools we use
FAQ
Questions about dashboards
Which dashboard tools?
Looker Studio, Metabase, Power BI or a custom React dashboard, based on your needs.
Does it update automatically?
Yes, dashboards connect to live data and refresh on schedule.
Can clients see it?
Yes, with secure sharing or embedding in your product.
Related services
Often combined with
Ready to talk about dashboards?
Send a short brief or book a call. A senior engineer replies within a few hours.